
In
the world of data science and machine learning, having access to
diverse datasets for experimentation is crucial. However, real-world
data can be scarce, sensitive, or simply not available. This is where
generating fake data becomes invaluable. In this post, I’ll walk you
through creating a fake data generator using Python’s Faker library and displaying this data in a well-styled table using pandas.
What You’ll Need
Before we dive in, ensure you have the following installed:
- Python 3.x
pandaslibrary:pip install pandasFakerlibrary:pip install faker
Step-by-Step Guide
Let’s build a script that generates a set of fake personal data and displays it in a structured format.
1. Import Necessary Libraries
First, import the Faker and pandas libraries:
from faker import Faker
import pandas as pd
2. Initialize Faker
Create an instance of the Faker class:
fake = Faker()3. Generate Fake Data
Define a dictionary to store the fake data:
data = {
    'First Name': [],
    'Last Name': [],
    'DOB': [],
    'Email': [],
    'City': [],
    'Country': [],
    'ZipCode': [],
}
Use a loop to populate the dictionary with fake data: say 10 records
for i in range(11):
    data['First Name'].append(fake.first_name())
    data['Last Name'].append(fake.last_name())
    data['DOB'].append(fake.date_of_birth())
    data['Email'].append(fake.email())
    data['City'].append(fake.city())
    data['ZipCode'].append(fake.zipcode())
    data['Country'].append(fake.country())
4. Create a DataFrame
Convert the dictionary to a pandas DataFrame:
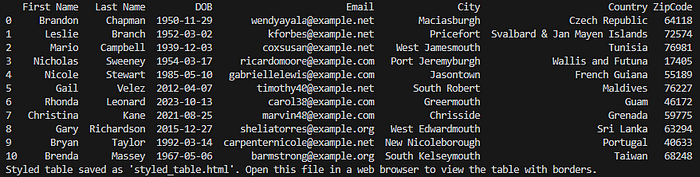
df = pd.DataFrame(data)Print the DataFrame to see the generated data:
print(df)5. Style the DataFrame (Optional)
To display the DataFrame with borders, define a style and save the styled DataFrame to an HTML file:
styles = [
{'selector': 'table', 'props': [('border-collapse', 'collapse')]},
{'selector': 'th, td', 'props': [('border', '1px solid black'), ('padding', '5px')]},
]
styled_df = df.style.set_table_styles(styles)
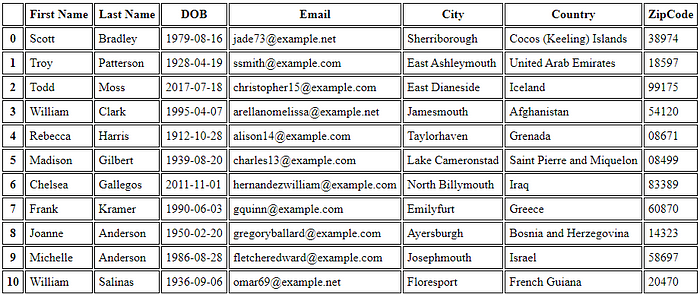
styled_df.to_html('styled_table.html')6. Open the Styled Table (Optional)
The styled DataFrame is saved as styled_table.html. You can open this file in a web browser to view the data in a neat, tabular format with borders.
print("Styled table saved as 'styled_table.html'. Open this file in a web browser to view the table with borders.")Full Code
Here’s the full script:
from faker import Faker
import pandas as pd

fake = Faker()

data = {
    'First Name': [],
    'Last Name': [],
    'DOB': [],
    'Email': [],
    'City': [],
    'Country': [],
    'ZipCode': [],
}

for i in range(11):
    data['First Name'].append(fake.first_name())
    data['Last Name'].append(fake.last_name())
    data['DOB'].append(fake.date_of_birth())
    data['Email'].append(fake.email())
    data['City'].append(fake.city())
    data['ZipCode'].append(fake.zipcode())
    data['Country'].append(fake.country())

df = pd.DataFrame(data)

print(df)

# Generate a styled DataFrame and view it by saving the DataFrame to an HTML file and then opening that file in a web browser
# Define the table style to add borders
styles = [
    {'selector': 'table', 'props': [('border-collapse', 'collapse')]},
    {'selector': 'th, td', 'props': [('border', '1px solid black'), ('padding', '5px')]},
]

styled_df = df.style.set_table_styles(styles)
styled_df.to_html('styled_table.html')

print("Styled table saved as 'styled_table.html'. Open this file in a web browser to view the table with borders.")
Conclusion
Using Python’s Faker
library, you can easily generate realistic fake data for various
purposes, from testing to developing machine learning models. By
combining it with pandas, you can
structure this data in a DataFrame and apply styles to make it more
readable and visually appealing. This approach is not only practical but
also enhances the presentation of your data, making it easier to
analyze and share.
Open the styled_table.html
file in your web browser, and you'll see a beautifully formatted table
containing the fake data, ready for use in your projects. Happy coding!
No comments:
Post a Comment